
OVERVIEW: Talent Predicts Wins, so how did we do?
In the SEC this year, talent based predictions were down when compared to previous years. In-conference games typically run about an 80% correlation between the higher talent average and a win in the SEC. This year, those numbers dropped to to about 70% on a game-by-game basis.
We will begin with a look at how well the SEC fared over-all, and end with a specific discussion of UT and Coach Jones first year and a way-too-early look to the future.
THE SEC AT LARGE.
.jpg")
Using four year talent averages as a guide, I have created this chart to show how those predictions did against reality. For every rectangle, the yellow highlighted team is the "subject". Any team below (lower talent averages) should be a win (green). Any team above (higher talent average) should be a loss (red). You can see that using these numbers to predict the seasonal outcomes resulted in 9 of 14 teams (64%) finishing within one game of talent predictions. 11 of 14 teams (79%) finished within two games of their predicted outcomes. Only three teams, Mizzou, Vandy and Florida, finished more than 2 games outside of talent predictions.
Missouri was the largest over-performer at +5 SEC games, and Florida is the largest under-performer at -5. This puts Pinkel at +5 for his career in the SEC, and Muschamp at -10 games. As a note, the threshold for firing is about -4 games below talent predictions in a single season.
Auburn, for all of the noise, finished EXACTLY as talent predicted. They lost to LSU whom they out-recruited, and beat Bama who they didn't. That is a wash, and they finished the season 7-1.
Talent predicts that the SEC championship game leans heavily in Auburn's favor (7.25 v. 34.75).
YOUR UNIVERSITY OF TENNESSEE VOLUNTEERS
.jpg")
Before we begin this conversation, a brief discussion of Butch Jones is in order. Butch has never fallen below talent predictions as a coach before arriving at UT. In fact, over his whole career, Jones averages +3 games a year more than talent predicts (including his first year at UT). The key to reviewing Jones as a coach is seeing that Jones also improves talent in relation to his competition.
It took Jones two years at CMU before he won more games than his predecessor (8), and his first year at Cincy he won 8 games less than Kelly's last. Some cursory research into this phenomenon reveals that Kelly left a very depleted and angry roster at Cincy, and it took Jones a year for the full buy-in from a team that had experienced a 12 win season the year before.
His first year at CMU, Jones lost to NDSU by blow-out fashion (44-14 if memory serves) but still over-performed by 5 games. There are some intriguing losses on his resume (NDSU, Toledo, Uconn) but also some intriguing wins against teams who had recruited far superior talent (Michigan State, Pittsburgh, NCSU, Virginia Tech). It should be noted that while Jones is 1-1 against James Franklin at Vandy, he has had a superior roster both times.
Yes, Jones Cincy Bearcat team was Dooley's "signature" win. Dooley had a team averaging top 15 talent, and ran over a team who barely broke the top half of division 1 recruiting. That is neither a signature win, nor a signature loss, by either party.
Bottom line about Jones, his teams have won 10 games at least 50% of his career (if you count the 2012 bowl win against Duke that Jones did not coach as a win accredited to him). Overall, including this year, Jones averages 8 win seasons. Not too shabby when you see that talent predicted an average of 5 wins a year. If our talent continues to rise, imagine what an over-performance by 3 games a year would look like in the SEC.
2013
Talent predicted that Jones version of the Volunteers should go 7-5. Instead the Vols went 5-7 (it should be noted that Vegas thought the Vols would go 5-7). Jones spoke of razor thin margins: Team 117 missed the talent prediction mark by 7 points, give or take. Remember this was with a 4th string true-freshman QB coming in mid-season, against the pride of the SEC.
Much has been made about the attrition of UT being singular. I had looked into it, and found what I thought was proof that UT's attrition was well within the average ranges. I was wrong.

What I thought I saw there was a roster that when all attrition up to the spring game was added in, was unchanged in relationship to the other rosters in the SEC east. It wasn't until I saw the chart below, that I realized that I hadn't been looking close enough at how attrition, and walk-ons, had affected unit groupings on the field.

If you look at this chart, it compares the average star rating of every player on the two deep, including walk-ons, broken down by rough position groups. It then compares that with a rough approximation of what we can expect in 2014 with the incoming recruiting class replacing those projected to leave, and the lower rated or walk-on players. As you can see from this chart, Jones fielded a team that averaged (using Rivals data) a 5.11 player (or no star rating). The two deep had its bright spots, including the offensive backfield and defensive line. The weaknesses (given the two deep averages) were the secondary and receivers.
I haven't had the time, or the desire, to do this for all SEC teams to see if it drives the actual talent predictions downward. My gut tells me that it would probably explain the under-performance and make the win against SCAR look spectacular. At least that is what I hope I would find.
2014: too early to make predictions, but let's do it anyway.
Using a rough approximation of the incoming players, look at the jumps made in talent on the two deep that will see the field next season. Every position group beside defensive line and offensive backfield drastically improve. Linebackers go from averaging 3 to 4 stars, secondary goes from being not-ranked to averaging 3 stars, receivers go from being not-ranked on average, to averaging 4 stars. Overall, the average caliber of player on the two deep goes from not ranked, to 5 one hundredths of a point from averaging 4 star players. That is a drastic jump in raw talent, even if it comes in young.
The bright side? 14 of those players should enter as early enrollees, meaning they will get to participate in spring lifting, spring training, and all summer practices. That is huge for a young incoming class expecting to make drastic strides on the field.
Remember, Jones tends to over-perform by about 3 games a year, on average, but tends to appear stagnant, or worse, his first year on the job.
Stay tuned, I will do another talent prediction matrix after signing day, and we can then discuss how this incoming class should affect the seasonal predicted performance. For all of the nay-saying and hand-wringing, I see something very bright rising on the horizon...and it is orange.
EDIT: I left out what I believe is one of the most interesting comparisons of this whole evaluation.
Is 5-7 the same as 5-7?
Is Dooley's last season the same as Jones' first? The record would indicate so, but I think a deeper evaluation says no.
Dooley was a chronic under-performer, peaking at about 4 games a year. 4 games is the threshold delineating when a coach tends to get fired for under-performance (pay attention Florida fans). Worst case scenario, Jones under performed by two games in his inaugural year. That is an improvement over half from what we have seen the previous 3-4 years.
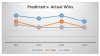
The following chart illustrates both Dooley's and Jones' talent predicted wins and losses over their tenure at UT. Notice how the talent predicted wins/losses trend about 2 games above Vegas predicted wins losses.
What this adds to my evaluation of Dooley is that not only did he find ways to not utilize talent, that our talent tended to drop in relation to our competition over his tenure.
In the SEC this year, talent based predictions were down when compared to previous years. In-conference games typically run about an 80% correlation between the higher talent average and a win in the SEC. This year, those numbers dropped to to about 70% on a game-by-game basis.
We will begin with a look at how well the SEC fared over-all, and end with a specific discussion of UT and Coach Jones first year and a way-too-early look to the future.
THE SEC AT LARGE.
Using four year talent averages as a guide, I have created this chart to show how those predictions did against reality. For every rectangle, the yellow highlighted team is the "subject". Any team below (lower talent averages) should be a win (green). Any team above (higher talent average) should be a loss (red). You can see that using these numbers to predict the seasonal outcomes resulted in 9 of 14 teams (64%) finishing within one game of talent predictions. 11 of 14 teams (79%) finished within two games of their predicted outcomes. Only three teams, Mizzou, Vandy and Florida, finished more than 2 games outside of talent predictions.
Missouri was the largest over-performer at +5 SEC games, and Florida is the largest under-performer at -5. This puts Pinkel at +5 for his career in the SEC, and Muschamp at -10 games. As a note, the threshold for firing is about -4 games below talent predictions in a single season.
Auburn, for all of the noise, finished EXACTLY as talent predicted. They lost to LSU whom they out-recruited, and beat Bama who they didn't. That is a wash, and they finished the season 7-1.
Talent predicts that the SEC championship game leans heavily in Auburn's favor (7.25 v. 34.75).
YOUR UNIVERSITY OF TENNESSEE VOLUNTEERS
Before we begin this conversation, a brief discussion of Butch Jones is in order. Butch has never fallen below talent predictions as a coach before arriving at UT. In fact, over his whole career, Jones averages +3 games a year more than talent predicts (including his first year at UT). The key to reviewing Jones as a coach is seeing that Jones also improves talent in relation to his competition.
It took Jones two years at CMU before he won more games than his predecessor (8), and his first year at Cincy he won 8 games less than Kelly's last. Some cursory research into this phenomenon reveals that Kelly left a very depleted and angry roster at Cincy, and it took Jones a year for the full buy-in from a team that had experienced a 12 win season the year before.
His first year at CMU, Jones lost to NDSU by blow-out fashion (44-14 if memory serves) but still over-performed by 5 games. There are some intriguing losses on his resume (NDSU, Toledo, Uconn) but also some intriguing wins against teams who had recruited far superior talent (Michigan State, Pittsburgh, NCSU, Virginia Tech). It should be noted that while Jones is 1-1 against James Franklin at Vandy, he has had a superior roster both times.
Yes, Jones Cincy Bearcat team was Dooley's "signature" win. Dooley had a team averaging top 15 talent, and ran over a team who barely broke the top half of division 1 recruiting. That is neither a signature win, nor a signature loss, by either party.
Bottom line about Jones, his teams have won 10 games at least 50% of his career (if you count the 2012 bowl win against Duke that Jones did not coach as a win accredited to him). Overall, including this year, Jones averages 8 win seasons. Not too shabby when you see that talent predicted an average of 5 wins a year. If our talent continues to rise, imagine what an over-performance by 3 games a year would look like in the SEC.
2013
Talent predicted that Jones version of the Volunteers should go 7-5. Instead the Vols went 5-7 (it should be noted that Vegas thought the Vols would go 5-7). Jones spoke of razor thin margins: Team 117 missed the talent prediction mark by 7 points, give or take. Remember this was with a 4th string true-freshman QB coming in mid-season, against the pride of the SEC.
Much has been made about the attrition of UT being singular. I had looked into it, and found what I thought was proof that UT's attrition was well within the average ranges. I was wrong.
What I thought I saw there was a roster that when all attrition up to the spring game was added in, was unchanged in relationship to the other rosters in the SEC east. It wasn't until I saw the chart below, that I realized that I hadn't been looking close enough at how attrition, and walk-ons, had affected unit groupings on the field.
If you look at this chart, it compares the average star rating of every player on the two deep, including walk-ons, broken down by rough position groups. It then compares that with a rough approximation of what we can expect in 2014 with the incoming recruiting class replacing those projected to leave, and the lower rated or walk-on players. As you can see from this chart, Jones fielded a team that averaged (using Rivals data) a 5.11 player (or no star rating). The two deep had its bright spots, including the offensive backfield and defensive line. The weaknesses (given the two deep averages) were the secondary and receivers.
I haven't had the time, or the desire, to do this for all SEC teams to see if it drives the actual talent predictions downward. My gut tells me that it would probably explain the under-performance and make the win against SCAR look spectacular. At least that is what I hope I would find.
2014: too early to make predictions, but let's do it anyway.
Using a rough approximation of the incoming players, look at the jumps made in talent on the two deep that will see the field next season. Every position group beside defensive line and offensive backfield drastically improve. Linebackers go from averaging 3 to 4 stars, secondary goes from being not-ranked to averaging 3 stars, receivers go from being not-ranked on average, to averaging 4 stars. Overall, the average caliber of player on the two deep goes from not ranked, to 5 one hundredths of a point from averaging 4 star players. That is a drastic jump in raw talent, even if it comes in young.
The bright side? 14 of those players should enter as early enrollees, meaning they will get to participate in spring lifting, spring training, and all summer practices. That is huge for a young incoming class expecting to make drastic strides on the field.
Remember, Jones tends to over-perform by about 3 games a year, on average, but tends to appear stagnant, or worse, his first year on the job.
Stay tuned, I will do another talent prediction matrix after signing day, and we can then discuss how this incoming class should affect the seasonal predicted performance. For all of the nay-saying and hand-wringing, I see something very bright rising on the horizon...and it is orange.
EDIT: I left out what I believe is one of the most interesting comparisons of this whole evaluation.
Is 5-7 the same as 5-7?
Is Dooley's last season the same as Jones' first? The record would indicate so, but I think a deeper evaluation says no.
Dooley was a chronic under-performer, peaking at about 4 games a year. 4 games is the threshold delineating when a coach tends to get fired for under-performance (pay attention Florida fans). Worst case scenario, Jones under performed by two games in his inaugural year. That is an improvement over half from what we have seen the previous 3-4 years.
The following chart illustrates both Dooley's and Jones' talent predicted wins and losses over their tenure at UT. Notice how the talent predicted wins/losses trend about 2 games above Vegas predicted wins losses.
What this adds to my evaluation of Dooley is that not only did he find ways to not utilize talent, that our talent tended to drop in relation to our competition over his tenure.
Attachments
Last edited:

