CHART: Every Tennessee AP Poll Ranking Ever

#1

mrmax86

Fight. Strain. Compete.
Joined
Jun 11, 2012
Messages
8,756
Likes
32,681
#1
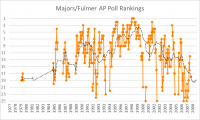
If this doesn't say it all, I don't know what does. Every data point on this chart is a weekly AP poll rating. If there is no dot, there was no ranking that week. As you can see, the mire we'd been in since 2008 is obvious, and was the longest we'd ever endured. Very few rankings since 07. NO MORE!

I have the data saved if anyone wants to know anything else about it. Click on the image below to expand it and see more detail.

1666027404992.png
 
#2
#2
If this doesn't say it all, I don't know what does. Every data point on this chart is a weekly AP poll rating. If there is no dot, there was no ranking that week. As you can see, the mire we'd been in since 2008 is obvious, and was the longest we'd ever endured. Very few rankings since 07. NO MORE!

I have the data saved if anyone wants to know anything else about it. Click on the image below to expand it and see more detail.

View attachment 502675


Thats actually pretty interesting...........thanks OP. At 41, its amazing how spoiled I was in the late 80's and certainly the 90's. As much flack as we give Fulmer here these past couple years I have to say he REALLY was an amazing coach in his tenure.
 
#6
#6
If this doesn't say it all, I don't know what does. Every data point on this chart is a weekly AP poll rating. If there is no dot, there was no ranking that week. As you can see, the mire we'd been in since 2008 is obvious, and was the longest we'd ever endured. Very few rankings since 07. NO MORE!

I have the data saved if anyone wants to know anything else about it. Click on the image below to expand it and see more detail.
View attachment 502675
Thanks for sharing. But what happened to 1982? Were we ranked in ‘82? I don’t remember.
 
#7
#7
Thanks for sharing. But what happened to 1982? Were we ranked in ‘82? I don’t remember.
82 is on there, there's just so much data, some years don't show at the bottom. I don't show we were ranked in 1982. We weren't ranked from Week 11 of 1979 until Week 6 of 1985, according to my records.
 
  • Like
Reactions: TCNC53
#9
#9
Well done mrmax! Thank you. I keep thinking about how our 15 years of dwelling in the dark ages is making this rebirth under CJH THAT much sweeter. The night is darkest just before the dawn. And dammit if this isn’t the most glorious orange sunrise I’ve ever seen!
 
  • Like
Reactions: mrmax86
#10
#10
awesome chart - thanks! What this chart also also kinda shows is why there are still those amongst us (like me) that are still die-hard “Majors” fans and give him credit for bringing the program back alive (much like Huepel is right now, just not so dramatically). Pretty big gap between 1975 and 1985 (my freshman year… granted that 1988 season started pretty bad).
 
  • Like
Reactions: mrmax86
#12
#12
Nice chart. What does a moving average look like? Also, what is the average ranking overall and the by-coach ranking?
I'll update to add Moving Averages.
How do you want me to do the coach average ranking? If a coach has 10 weeks at an unranked level, and 30 ranked, how should that calculate out?
 
#14
#14
I'll update to add Moving Averages.
How do you want me to do the coach average ranking? If a coach has 10 weeks at an unranked level, and 30 ranked, how should that calculate out?
Don't worry- it's too much for a board discussion. I think a person can simply eyeball the average for each coach in the graph. It is Fulmer's tenure that is the most striking, because you can see the actual decline in outcomes.
Your question is a good one and something that I didn't think about. I was thinking about yearly ranking, but the problem still exists even in this measure. The only thing I can think of is to calculate the conditional average. In other words, when the team was ranked, the average ranking was _______ . I would have to think about this a little more.
 
#15
#15
Don't worry- it's too much for a board discussion. I think a person can simply eyeball the average for each coach in the graph. It is Fulmer's tenure that is the most striking, because you can see the actual decline in outcomes.
Your question is a good one and something that I didn't think about. I was thinking about yearly ranking, but the problem still exists even in this measure. The only thing I can think of is to calculate the conditional average. In other words, when the team was ranked, the average ranking was _______ . I would have to think about this a little more.
Doing it that way would be simple. I can do that easily.
 
#17
#17
Also, I wanted to isolate Majors/Fulmer into 1 chart so we could see how they flowed into each other. For those that don't know, Fulmer formally took over the team in 1993.

1666187998113.png
 
#18
#18
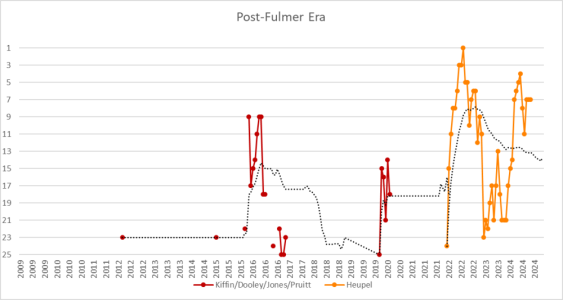
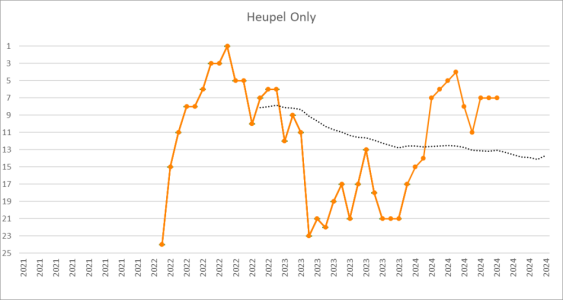
Hey guys. Ran across this file on my computer and wanted to update the charts!

For 2022/2023/2024, I also updated the rankings, and replaced the AP Poll Rank with the CFP Rank to reflect the accepted ranking for the given week.
Picture1.jpg
1731109552374.png
1731109570233.png
 
Last edited:
#19
#19
Sorry I don't know why the pictures are lower res. VN must be nuking them.
 

VN Store


Back
Top