Latest US Welfare Report

#1

TNVOLNAVY

May God have mercy for my enemies because I won't.
Joined
Oct 24, 2010
Messages
4,146
Likes
12,663
#1
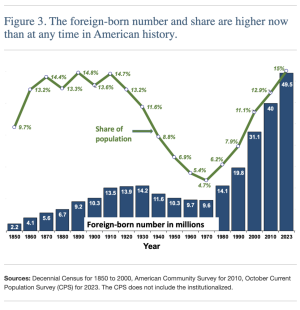
  • The 2022 SIPP indicates that 54 percent of households headed by immigrants — naturalized citizens, legal residents, and illegal immigrants — used one or more major welfare program. This compares to 39 percent for U.S.-born households.
IMG_0549.png


  • Like
Reactions: norrislakevol
#2
#2
  • The 2022 SIPP indicates that 54 percent of households headed by immigrants — naturalized citizens, legal residents, and illegal immigrants — used one or more major welfare program. This compares to 39 percent for U.S.-born households.
View attachment 603522


Good grief. The 2nd stat is worse than the first.

39% of US households are on at least 1 kind of welfare? I hope that includes SS...which is a right and not really income redistribution for most of us since we pay into it for our entire working lives. Either way, thats a terrible stat because not even half that many are on SS...

It is criminal that 1/3 of every paycheck/bonus that i earn is stolen from me and given to a large % of folks these days that are too lazy, inept, or unwilling to go to work and support themselves. Its 1 thing to be unABLE to work or provide, its an entirely different matter to be unWILLING to earn their keep. We need to protect and provide for those who are truly disabled, widows/elderly folks, etc....but we also badly need to police these programs and get these deadbeats off the public teet. Especially when the feds cause record inflation and our purchasing power is neutered.
 
#3
#3
Good grief. The 2nd stat is worse than the first.

39% of US households are on at least 1 kind of welfare? I hope that includes SS...which is a right and not really income redistribution for most of us since we pay into it for our entire working lives. Either way, thats a terrible stat because not even half that many are on SS...

It is criminal that 1/3 of every paycheck/bonus that i earn is stolen from me and given to a large % of folks these days that are too lazy, inept, or unwilling to go to work and support themselves. Its 1 thing to be unABLE to work or provide, its an entirely different matter to be unWILLING to earn their keep. We need to protect and provide for those who are truly disabled, widows/elderly folks, etc....but we also badly need to police these programs and get these deadbeats off the public teet. Especially when the feds cause record inflation and our purchasing power is neutered.
if you make or made over 45k at any point in your career it 100% is wealth redistribution, unless you live to like 100. there is a huge number of people who draw from it who never contributed.
 
#4
#4
Good grief. The 2nd stat is worse than the first.

39% of US households are on at least 1 kind of welfare? I hope that includes SS...which is a right and not really income redistribution for most of us since we pay into it for our entire working lives. Either way, thats a terrible stat because not even half that many are on SS...

It is criminal that 1/3 of every paycheck/bonus that i earn is stolen from me and given to a large % of folks these days that are too lazy, inept, or unwilling to go to work and support themselves. Its 1 thing to be unABLE to work or provide, its an entirely different matter to be unWILLING to earn their keep. We need to protect and provide for those who are truly disabled, widows/elderly folks, etc....but we also badly need to police these programs and get these deadbeats off the public teet. Especially when the feds cause record inflation and our purchasing power is neutered.

Does NOT include SS or Medicare!

The bottom line takeaway is that democrats are guaranteed to get the votes of 39% of US born households and 54% of immigrant households. Nothing sells better than the promise of free chyt.
 
#5
#5
Does NOT include SS or Medicare!

The bottom line takeaway is that democrats are guaranteed to get the votes of 39% of US born households and 54% of immigrant households. Nothing sells better than the promise of free chyt.

As long as we keep the illegals from casting illegal votes, then we don't have to worry about it but democrats are doing all they can to make them voters. They are going at it geezer necked, leaning forward and full throated.
 
#6
#6
As long as we keep the illegals from casting illegal votes, then we don't have to worry about it but democrats are doing all they can to make them voters. They are going at it geezer necked, leaning forward and full throated.
****..they want to make them law enforcement. Imagine being arrested by an illegal.
 
#7
#7
As long as we keep the illegals from casting illegal votes, then we don't have to worry about it but democrats are doing all they can to make them voters. They are going at it geezer necked, leaning forward and full throated.


Democrats are playing the long game. Their eye is on the future generations that are yet to be born.
 
#9
#9
As long as we keep the illegals from casting illegal votes, then we don't have to worry about it but democrats are doing all they can to make them voters. They are going at it geezer necked, leaning forward and full throated.
Exactly! This is the purpose of the game for them. They don't care about our country, they only care about power.
 
#10
#10
The people streaming across our borders now are total losers. Only 2 percent of migrants in NYC had even APPLIED for a work permit as of mid October. These stats are about to get even worse. I hate democrats so bad.
 
  • Like
Reactions: marcusluvsvols
#11
#11
Instead if using a hate group's estimates (read their report, they will say its their estimates), lets look at actual numbers

In terms of %, Top 10 states with most immigrants

CT, MD, HI, MD, TX, NV, FL, NY, NJ, CA

Top 10 States with highest food stamp %

LA, NM, WV, OK, OR, MA, NV, IL, AL, NC
 
#13
#13
Instead if using a hate group's estimates (read their report, they will say its their estimates), lets look at actual numbers

In terms of %, Top 10 states with most immigrants

CT, MD, HI, MD, TX, NV, FL, NY, NJ, CA

Top 10 States with highest food stamp %

LA, NM, WV, OK, OR, MA, NV, IL, AL, NC
Your high food stamp listed states are high minority/ Native American populations.. but that would be conflating two disparate issues
 
#15
#15
Your high food stamp listed states are high minority/ Native American populations.. but that would be conflating two disparate issues

Pretty much the states with the highest % of food stamp assistance recipients are those like you mentioned, states with a higher than avg. Native American or AA population, not the states with high immigrant population.

If you look at WOTC eligibility (which includes all forms of public assistance), the 10 states with the greatest % variance between WOTC eligible and % of population are as follows: OK, IL, NM, LA, MS, AL, AR, KY, WV, and NY. Different source of info but largely same results. Again, very little overlap with these states and those with the most immigrants...
 
  • Like
Reactions: AM64
#16
#16
Pretty much the states with the highest % of food stamp assistance recipients are those like you mentioned, states with a higher than avg. Native American or AA population, not the states with high immigrant population.

If you look at WOTC eligibility (which includes all forms of public assistance), the 10 states with the greatest % variance between WOTC eligible and % of population are as follows: OK, IL, NM, LA, MS, AL, AR, KY, WV, and NY. Different source of info but largely same results. Again, very little overlap with these states and those with the most immigrants...
You can take data and manipulate it any way you want. Fact is illegal immigration is costing this nation hundreds of billions in fed welfare, state and city support and handouts.
 
#18
#18
You can take data and manipulate it any way you want. Fact is illegal immigration is costing this nation hundreds of billions in fed welfare, state and city support and handouts.

Yes, it is absolutely. Im not arguing that. But to take a hate group's "estimates" and pass them off as gospel when other actual data suggests a lot of citizens in this country are abusing the system as much, if not more...
 
#19
#19
Other than Medicaid, which varies wildly from state to state, SNAP is largest assistance program (and is based on a numerical formula)...
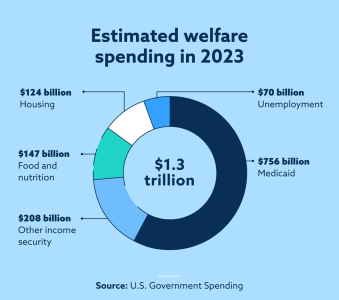
and SNAP still only represents $120B of about $600B for 80 fed welfare programs, and state and local programs just to be clear. So convoluted and excessive not sure anybody knows the real number.


#20
#20
Yes, it is absolutely. Im not arguing that. But to take a hate group's "estimates" and pass them off as gospel when other actual data suggests a lot of citizens in this country are abusing the system as much, if not more...
why are they a “hate group”?
 
#23
#23
and SNAP still only represents $120B of about $600B for 80 fed welfare programs. So convoluted abd excessive not sure anybody knows the real number.


Since this thread was talking about % of people, I was referring to number of people that participate. SNAP is formula based so if you are near upper end of limit, you could earn $25 a month. There's no $25 housing vouchers floating around.

The data is several years old (but I bet its about the same) but the areas with the highest % of EITC are OK, Detroit, Memphis, New Orleans, MS, AL, GA, SC. Not exactly the immigration capitals of America...

Edit - (South Texas was up there but still behind those areas)

It's another debate as to whether EITC is welfare but at a minimum, it is a wealth redistribution...
 
Last edited:
#24
#24
You can take data and manipulate it any way you want. Fact is illegal immigration is costing this nation hundreds of billions in fed welfare, state and city support and handouts.

WOTC eligibility covers pretty much all of the forms of public assistance (SSI, SNAP, Housing, Unemployment). It says pretty much the same thing as the food stamp data says. The EITC data (granted 7-8 yrs old) says the same thing.

@LadyVolette called out the trend in post 13...
 

VN Store


Back
Top