Official Global Warming thread (merged)

My only agenda is to bring some sense and balance to a thread that otherwise reflects poorly on my alma mater. Outside VN I'm not politically active.

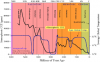
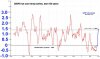
Putting aside the fact that we can tell what the climate was like before 1979 and that Earth is warming 50x faster than when it comes out of an ice age, you do realize that those claiming global warming stopped in 1998 were using a significantly smaller blip, right?

That's because you don't want people to see you cry when they make fun of you. Here you just cry on your keyboard.
 
That darn global warming sank the Titanic!

Iceberg that sank Titanic estimated to be 100,000 years old - AOL

And while the block measured approximately 400 feet long and protruded 100 feet above the water when the ship crashed into it, the iceberg likely started out being around 1,700 feet long when it began drifting from the Greenland area.

Unusually warm temperatures is one hypothesis for why the breakaway occurred around 1908.
 
Those trying to keep you from the ledge are offering balance.

Add some reason to your scare tactics. It will all be ok.
That's because you don't want people to see you cry when they make fun of you. Here you just cry on your keyboard.
Crying? Scare tactics? That post was just pointing out some simple facts vis-à-vis the ole “no global warming since 1998” talking point and poking fun at BOT’s logic.

If the facts upset you then that is more of a reflection of your state than mine.
 
  • Like
Reactions: 4 people
And your escalator is a pimple on an elephant's ass.
The first time you posted this it could be passed off as an honest mistake. Now you’re just blatantly, intentionally trying to mislead people.

GISP2 is from one location and is not representative of global temperature as your figure suggests. GISP2 also ends around 1855. Same thing is true with your atmospheric CO2 plot. Atmospheric CO2 barely changed from 11000 years ago until the industrial revolution, yes, but today it is over 400 ppm. That’s way off your chart! Check before you post; this is obvious stuff here SandVol. You can’t refute the hockey stick by cutting off (or should I say, "covering up"?) the blade.

Again, it's not representative of global temperature, but here is what a more up-to-date version of your misleading figure would look like:

c4u-chart5.png
 
  • Like
Reactions: 4 people
This too is remarkably misleading, even for Mr. Goddard. It’s like he just crammed as many denier memes in there as possible. I’ll just stick to the central issue here:

He’s splicing two entirely different data sets (that were published nearly 40 years apart). The "pre-1979" plot from 1977 shows temperatures averaged over the entire atmosphere, from the troposphere to the stratosphere. The recent figure from NOAA separates the different temperature trends at different altitudes. This is important because the troposphere is warming

globallevels850to300b.png


while the stratosphere is cooling

globallevels100to30.png


just as scientists predicted decades ago.
 
  • Like
Reactions: 4 people
Crying? Scare tactics? That post was just pointing out some simple facts vis-à-vis the ole “no global warming since 1998” talking point and poking fun at BOT’s logic.

If the facts upset you then that is more of a reflection of your state than mine.

Ugh. Bart, sigh, you're better than this.

I am perfectly content with things.
 
The first time you posted this it could be passed off as an honest mistake. Now you’re just blatantly, intentionally trying to mislead people.

GISP2 is from one location and is not representative of global temperature as your figure suggests. GISP2 also ends around 1855. Same thing is true with your atmospheric CO2 plot. Atmospheric CO2 barely changed from 11000 years ago until the industrial revolution, yes, but today it is over 400 ppm. That’s way off your chart! Check before you post; this is obvious stuff here SandVol. You can’t refute the hockey stick by cutting off (or should I say, "covering up"?) the blade.

Again, it's not representative of global temperature, but here is what a more up-to-date version of your misleading figure would look like:

c4u-chart5.png

You stop misrepresenting. it's a pimple on an elephant's ass. Your hockey stick and escalator misrepresent the big picture.
 

Attachments

  • Vostok.jpg
    Vostok.jpg
    39.7 KB · Views: 6
The first time you posted this it could be passed off as an honest mistake. Now you’re just blatantly, intentionally trying to mislead people.

GISP2 is from one location and is not representative of global temperature as your figure suggests. GISP2 also ends around 1855. Same thing is true with your atmospheric CO2 plot. Atmospheric CO2 barely changed from 11000 years ago until the industrial revolution, yes, but today it is over 400 ppm. That’s way off your chart! Check before you post; this is obvious stuff here SandVol. You can’t refute the hockey stick by cutting off (or should I say, "covering up"?) the blade.

Again, it's not representative of global temperature, but here is what a more up-to-date version of your misleading figure would look like:

c4u-chart5.png

Here's the recent instrument record at the site. Nothing remarkable.
 

Attachments

  • sg2wav.jpg
    sg2wav.jpg
    43.9 KB · Views: 2
Yes, I’m glad the authorities are finally taking a look. And Bret Baier (& VN) losing its **** more than made up for witnessing Rubio’s painfully lame evasion of the debates’ rare climate question.

You deniers may want to quieten down. You may get a RICO suit brought against you.

Senator: Use RICO Laws to Prosecute Global Warming Skeptics | The Weekly Standard
Lol. Lookout science deniers, Obama’s gestapo is coming for you!

Talk about scare tactics…
 
  • Like
Reactions: 3 people

VN Store


Back
Top