Tucker Carlson Obsession Thread (merged)

The unrelenting ignorance of the left. I decided to take a look at her twitter page to see what was being said since she mentioned people should pray about getting the vaccine.

It's not too surprising that because she retweeted Tucker Carlson that the dumbest of the lot is trying to convince her he is a white supremist, white nationalist, etc. These are people that are hard to reason with and are generally racist themselves. Even as a black woman she gets attacked by the left if she steps out of line. I think it's a wake up call.

https://mobile.twitter.com/nickiminaj
 
Last edited:
The unrevolting ignorance of the left. I decided to take a look at her twitter page to see what was being said since she mentioned people should pray about getting the vaccine.

It's not too surprising that because she retweeted Tucker Carlson that the dumbest of the lot is trying to convince her he is a white supremist, white nationalist, etc. These are people that are hard to reason with and are generally racist themselves. Even as a black woman she gets attacked by the left if she steps out of line. I think it's a wake up call.

https://mobile.twitter.com/nickiminaj
I'm thinking "unrevolting" wasn't what you meant to say there.
 
  • Like
Reactions: BreatheUT
Thursday, Sept. 23 Scoreboard: The Five Extends Total Viewers Winning Streak to Four Days

Tucker Carlson was Number One in the 25-54 demo, and second in total viewers
 
  • Like
Reactions: BreatheUT
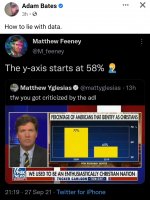
What exactly is the point that Adam Bates and n_huffines, as the poster of this tweet are trying to make? The data is accurate. The graph is accurate. If idiots can't understand the graph, then they should be addressing their complaints to the socialists running the U.S. educational system.
 
Last edited:
What exactly is the point that Adam Bates and n_huffines, as the poster of this tweet trying to make? The data is accurate. The graph is accurate. If idiots can't understand the graph, then they should be addressing their complaints to the socialists running the U.S. educational system.

The problem is there are some idiots watching Fox News and he's successfully tricking them. Your perception of public education does not absolve him.
 
Last edited:
The problem is there are some idiots watching Fox News and he's successfully tricking them. Your perception of public education does not absolve him.
Tricking them, how? The graph is accurate. Does he need to have a disclaimer underneath the graph to explain it to uneducated idiots that would try to claim that it is "tricking people"? Newsflash: The Y-Axis in that graph is clearly and properly labeled. The Y-Axis in a graph does NOT have to start at 0. It can start anywhere. They even clearly labeled the numbers on the data (which they didn't have to do) - 77% in 2009 and 65% in 2019.
 
Last edited:
Tricking them, how? The graph is accurate. Does he need to have a disclaimer underneath the graph to explain it to uneducated idiots that would try to claim that it is "tricking people"?

The people pointing out the deception are not tricked by it, obviously.

The whole entire point of a visual graph is to help people digest the data that you're trying to communicate. The only time you would start a graph at any place other than 0 is if it somehow helps the viewer digest the information better. He's intentionally showing a visual aid that displays a much starker decline than what we're seeing. According to PEW, we saw a 16% decline in people claiming Christian beliefs. The non-numeric components of the visual are making it look like a 63% decline. There is no reason to do it this way unless you are trying to manipulate.
 
The people pointing out the deception are not tricked by it, obviously.

The whole entire point of a visual graph is to help people digest the data that you're trying to communicate. The only time you would start a graph at any place other than 0 is if it somehow helps the viewer digest the information better. He's intentionally showing a visual aid that displays a much starker decline than what we're seeing. According to PEW, we saw a 16% decline in people claiming Christian beliefs. The non-numeric components of the visual are making it look like a 63% decline. There is no reason to do it this way unless you are trying to trick people.
Apparently the answer to the rhetorical question I posed in my previous post is yes. He must post a disclaimer to explain a graph to the uneducated, liberal idiots.
 
Apparently the answer to the rhetorical question I posed in my previous post is yes. He must post a disclaimer to explain a graph to the uneducated, liberal idiots.

He doesn't need to post a disclaimer, he needs to make a graph that indicates he successfully passed stats 101.
 
He doesn't need to post a disclaimer, he needs to make a graph that indicates he successfully passed stats 101.

Your parents should be seeking a refund for the tax dollars they paid toward your education. You obviously didn't actually receive one.
 
Your parents should be seeking a refund for the tax dollars they paid toward your education. You obviously didn't actually receive one.

Home schooled by the most right-wing Mom you could possibly imagine.

Imagine you're a CEO and the VP of sales comes in with quarterly numbers that show an increase of 1.6% but the visual graphics made it look like a 6.3% increase. How much loss of trust would there be? You're probably dressing him down right there and saying stuff like "what do you think, that I'm stupid?"

That's what Tucker thinks about his viewers.
 
That's what Tucker thinks about his viewers.
Tucker thinks that his viewers are smart enough to accurately comprehend a graph that is completely and accurately labeled, including data labels on each of the columns clearly showing a drop from 77% in 2009 to 65% in 2019. Were he working for CNN, he would have known that he also needed to show an excerpt of "Reading and Accurately Understanding Graphs for Dummies". However, I'm sure he appreciates liberals like you tuning in to his show to further boost his ratings.
 
What exactly is the point that Adam Bates and n_huffines, as the poster of this tweet are trying to make? The data is accurate. The graph is accurate. If idiots can't understand the graph, then they should be addressing their complaints to the socialists running the U.S. educational system.

Lol...yeah. It's not a y-axis. It's a bar graph.

I guess some think of it as a y-axis but the intent not to be a traditional x and y graph using negative and positive integers.
 
Tucker thinks that his viewers are smart enough to accurately comprehend a graph that is completely and accurately labeled, including data labels on each of the columns clearly showing a drop from 77% in 2009 to 65% in 2019. Were he working for CNN, he would have known that he also needed to show an excerpt of "Reading and Accurately Understanding Graphs for Dummies". However, I'm sure he appreciates liberals like you tuning in to his show to further boost his ratings.

I promise you that he doesn't lump his whole audience into this segment. Only a buffoon would.
 
What exactly is the point that Adam Bates and n_huffines, as the poster of this tweet are trying to make? The data is accurate. The graph is accurate. If idiots can't understand the graph, then they should be addressing their complaints to the socialists running the U.S. educational system.
The graph is scaled to make it look worse than it actually is.
 
  • Like
Reactions: n_huffhines

VN Store


Back
Top