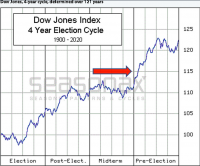
To verify I'm reading that correctly...so year 3 of a POTUS term is historically a flat year? Year 4 is a boom year?
It seems like that might be kind of right. I admit they don't stand out to me when I look at it (see chart). In the database used, the average is flat after the midterms. So that might be telling us there were lots of down years in year 3. I don't know why; gridlock is my favorite form of government. I can see that 1931 was a big one, and 1987, while memorable, is actually flat. So it really does look like there's an absence of big up years.
When you look at the very noticeable correlation of democrat vs republican presidents, that data can be overwhelmed by a few stock market runs. FDR/Truman get 20 years starting in 1932, and obviously that's huge. Meanwhile, Herbert Hoover gets a -75%.
And we've certainly seen some of that in my lifetime. The 84 to 2000 run-up was huge, and it accelerated starting in 94. Y2K peak was not political. The global financial crisis creates a significant minimum exactly at the time of Obama's inauguration and really, that's entirely political. The government chose to withdraw adult supervision from idiot bankers (under Bush whether we like it or not). So Bush gets a big burn from this. The run from that point to Christmas 2021 is huge, so huge that
Covid is not even noticeable anymore when you look at the chart. Whether we like it or not.
On the other hand, Nixon gets 5 years in there with no return at all, and in those days everything was political; the government took a shocking amount of control over the economy, whether we like it or not. There was a divot created right at the time of his resignation, and I guess he actually caused that personally. I don't know.
If you want to predict, I think you should believe the fed holds all the cards right now. When somebody tells you they're going to cause a recession, and they have the power to do so, I say believe them. They need to sell off their balance sheet and that's what adults would do. Whether we like it or not.


