You do realize that is true for EVERY defense in the nation including the best. Every defense has moments in games and even full games where they are ineffective. Every team in the playoff had those moments during the season. Ohio State did a number of times, Michigan did (in the playoffs) TCU did once they played real teams even Georgia's all-world defense did vs Kent State and Ohio State.
It's all about perspective and perception. When its your team, a bad performance is the end of the world and especially on these boards every single mistake in a game is agonized over. When we get scored on it's because the defense sucks not because the other team did something wrong. Trust me the fanbase of every single team that played UT outside of Georgia and South Carolina thought their DC should be fired after the game. In most cases, it was not their defenses that sucked it was our scheme they weren't ready for.
People need to realize it's not all black and white. Sometimes you can call the right play and execute it perfectly and still fail. In my eyes, our defense struggled because of injuries (lack of consistent personnel is a death knell for a defense and secondarily they had to play a ton of series which was exacerbated by the injuries. The fact they played a ton of series is not something they can control.... the offense scored a TON. this is exactly why
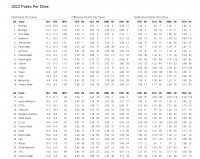
@Vol8188 is right on point to say look at points per drive. It's also an interesting stat for the offense because it kind of shows a picture a lot of people don't normally seem to see.
Last year UT was ranked 5th in NPD Net points per drive which is offensive-defensive points per drive. This is a measure of the whole team's efficiency. UT is ranked 7th in OPD which might surprise some but our offense is about the number of opportunities. We score a lot because we run a lot of plays and conversely our 37th-ranked DPD is affected by that same thing. No matter how much better I am than you or vice versa, given enough chances the weaker guy will still get some wins. The net SUM of the 2 puts us right where we deserved to be ranked end of the season.
View attachment 542603
note where TCU and LSU are ranked for giggles. Outside of those the final top 10(AP/Coaches) rankings of the season are very similar.
All these numbers are gotten from here. They remove garbage possessions as defined below
BCF Toys - 2022 Points Per Drive
Unless otherwise noted, all ratings and supporting data are calculated only after first filtering out garbage possessions, defined as of February 2021, as follows:
- An offensive possession of two plays or fewer that runs out the clock to conclude the first half, or that runs out the clock to conclude the second half with the score tied, and does not result in a turnover, score, or field goal attempt.
- A possession in the second half of a game in which eight times the number of the losing team's remaining possessions plus one is less than the losing team's scoring deficit at the start of the possession.
- An offensive possession of two plays or fewer by the losing team with a score deficit greater than eight points that runs out the clock to conclude the game.
- An offensive possession or non-offensive scoring possession by the winning team leading by eight points or fewer at the start of the possession that runs out the clock to conclude the game.
From 2007 to 2022, 10.7 percent of all possessions have been classified as garbage possessions according to these criteria. FBS games have averaged 26.3 total game possessions and 23.5 non-garbage possessions per game in that span.


